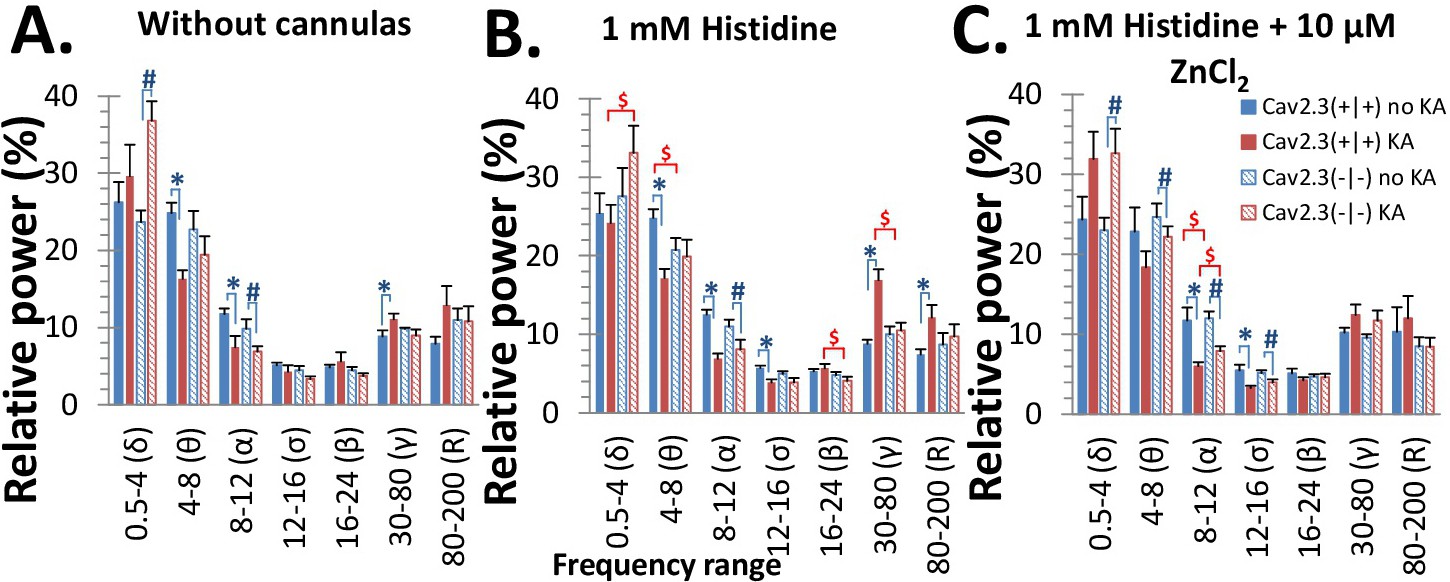
Fig. 4. Power-spectrum density (PSD) analysis of ictal episodes for the various frequency ranges. Relative power was used in the evaluation and statistical testing due to better inter-individual comparability. Lines and asterisks (*) and diamonds (#) in blue color highlight the differences between mice without and with KA i.p. injection (15 mg/kg bw). Statistical differences are significant for p<0.05. Lines in red color highlight the differences between both genotypes, and statistical differences are significant for p<0.05 ($).